

Source numbers link to evidence. [Inference] marks analytical judgment, including motion classifications and causal explanations. Public evidence does not establish every internal decision or metric.
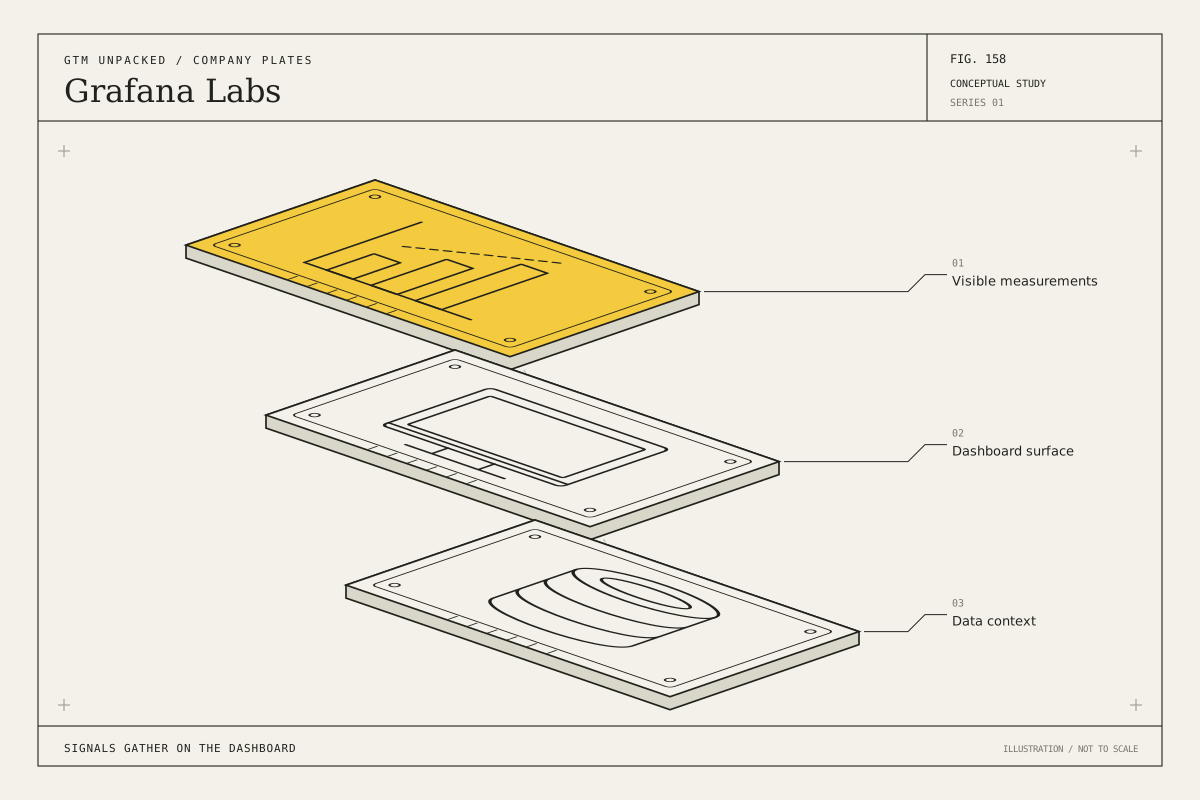
Conceptual illustration of measurement charts, a display, and a data cylinder, making observability visible as a still life rather than a literal telemetry architecture.
- Company
- Grafana Labs · Developer tools and communities · grafana.com
- Conversion motions
- [Inference] This research classifies Grafana Labs as Product Led, Human Led and Partner Led.
- Grafana Labs beachhead
- Engineers visualizing Graphite time-series metrics. [1]
- Grafana Labs target customer
- Observability practitioners and enterprises managing metrics, logs, traces and related telemetry. [2][3]
- Product complexity
- [Inference] A dashboard is easy to recognize; production telemetry architecture and cost are complex.
- Decision-making unit
- [Inference] Engineers can start; a shared observability platform adds platform, security and finance stakeholders.
- Market at entry
- Grafana began as a response to limited visualization around existing monitoring tools. [1]
- Market today
- A mature observability market combines open components, cloud services and enterprise operations. [2][3]
- Evidence
- Source-backed brief · 3 linked sources · research date · method and limitations
The ten-step Revenue Engine reading map
These links locate relevant evidence. A linked section does not imply every detail of the step is publicly established.
- Acquire Your First Customers: Founder Led Sales Read first customers
- Embrace GTM Experimentation Read experiments & lessons
- Understand Your GTM Motion Options Read GTM motion
- Pick Your GTM Motion Not established in this entry
- Generate a Lead Read GTM motion · Read experiments & lessons
- Turn Leads into Paying Customers Read GTM motion
- Retain and Grow Your Customers Read retain & expand
- Build Your GTM Team Not established in this entry
- Plan Your Tech Stack Read experiments & lessons
- Optimize and Scale Through Metrics Read pricing & economics
Grafana Labs origin and first customers: Visible utility spread inside organizations
Torkel Ödegaard created Grafana after finding Graphite’s interface inadequate and drawing inspiration from Kibana. In the company’s five-year retrospective, he described dashboards appearing on office screens and attracting colleagues’ attention. Raj Dutt and Anthony Woods invited him to New York for consulting work in 2014; the relationship became a company, initially called raintank. [1]
The founding roles combined Ödegaard’s project leadership with Dutt and Woods, who had worked together previously. The retrospective records CEO, CTO and Grafana-lead responsibilities. It does not establish the first paid contract or identify an early sales rep who closed it. [1]
[1]Grafana Labs GTM motion: An enthusiastic community was not yet a revenue engine
In the official documentary account, Dutt recalls community enthusiasm at the first GrafanaCON in 2015 alongside uncertainty about monetization. The business later combined broad data-source interoperability, managed Grafana Cloud and self-managed Enterprise offers. The company explicitly describes reinvesting commercial revenue in open-source technology. [2]
[Inference] This motion keeps the practitioner’s preferred interface while charging for a different job: reliable operation and organizational capability. Interoperability lowers the need to replace every existing system before adoption. It can also increase support complexity because customers bring varied data sources and environments. [2]
[2]Grafana Labs retention and expansion: Expansion depends on useful telemetry
The current offer includes community support at the free level, business-hours email support for Pro and premium assistance for enterprise commitments. Cloud packaging spans multiple telemetry types and deployment options. The site presents cost estimation and tools intended to reduce spending on unused telemetry. [3]
[Inference] Successful expansion should improve diagnosis and operating coverage, rather than simply ingest more data. A technical success team can help customers select useful signals, control cardinality and retention, and establish shared practices. Those services may increase trust even when they reduce an individual usage bill. Named early CSMs and account-level expansion results remain unverified. [3]
[3]Grafana Labs pricing and economics: The paid ladder is based on service and consumption
Observed November 2026, Grafana Cloud lists Free, Pro from $19 monthly plus usage, and Enterprise beginning at a $25,000 annual spend commitment. Retention, support and deployment needs vary by tier. These are current commercial boundaries, not the prices charged when the company first formed. [3]
[Inference] Free adoption and open software create distribution, but storage, processing and support must be funded. Usage growth alone is ambiguous: it may represent more valuable coverage or inefficient telemetry. A useful unit-economics analysis would separate product contribution and support cost by workload; the public price page does not provide those margins. [3]
[3]Grafana Labs experiments and lessons: The critical distinction
[Inference] Grafana’s attractive visualization helped awareness, but the company’s own account shows that awareness did not solve monetization. The eventual commercial logic preserved the practitioner interface while reducing operational burden. The lesson is to identify the paid responsibility around an adopted tool, not to assume that a large community will eventually pay without a changed offer. [1][2]
[Inference] A better expansion scorecard would connect telemetry spend with faster investigation, coverage of important services and fewer avoidable surprises in billing. The inspected sources do not establish controlled comparisons with competing vendors or a complete record of failed enterprise sales experiments. [3]
[3]Grafana Labs economics at a glance: Pricing is only half the story.
Free entry, Pro from $19/month plus usage, Enterprise from a $25,000 annual commitment. [3]
See the dated pricing analysis.
[Inference] The relevant costs and conversion frictions are discussed in the analysis; no invented margin model is supplied.
Not verified in this brief.
No cohort retention figure verified in this brief.
The people in the Grafana Labs GTM story: People & capabilities.
Torkel Ödegaard
Project creator and cofounderDeveloper working with Graphite and visualization.
Created Grafana and supplied its practitioner-focused interface. [1]
[1]Raj Dutt and Anthony Woods
CofoundersPreviously worked together before inviting Ödegaard to a consulting engagement.
Helped build a sustainable company around the project. [1][2]
[1] [2]Grafana Labs GTM: critical reading and analysis: Why it worked.
Where it breaks.
What worked—and why
[Inference] Interoperability and visible dashboards supported practitioner adoption.
What did not work
Dutt recalled uncertainty about monetization despite open-source momentum. [2]
What could have been better
[Inference] Tie expansion to useful telemetry and predictable spend.
What another founder can use
[Inference] A dashboard people displayed became an open ecosystem; managed observability supplied monetization.
Grafana Labs go-to-market FAQ: The questions that matter.
How did Grafana Labs find its GTM motion?
A dashboard people displayed became an open ecosystem; managed observability supplied monetization. See the sourced account and explicitly labeled analysis above.
Grafana Labs sources and open questions: Follow the sources.
- Grafana Labs at 5 Grafana Labs · primary · 2019-10-05
Inspected for the facts attributed in this brief; current pages observed November 10, 2026.
- The Business of Open Source Grafana Labs · primary
Inspected for the facts attributed in this brief; current pages observed November 10, 2026.
- Pricing Grafana Labs · primary
Inspected for the facts attributed in this brief; current pages observed November 10, 2026.
What remains unverified
First paid account and its original contract were not verified.
Named early sales and customer-success hires, training, compensation and individual account assignments remain incompletely documented.
No verified CAC, payback, funnel conversion or numerical retention series in this brief.
Historical website/pricing screenshots were not captured for this company; dated textual evidence is distinguished from current pages.
No verified visual capture is attached to this entry. A current screenshot is not a substitute for a historical capture.